
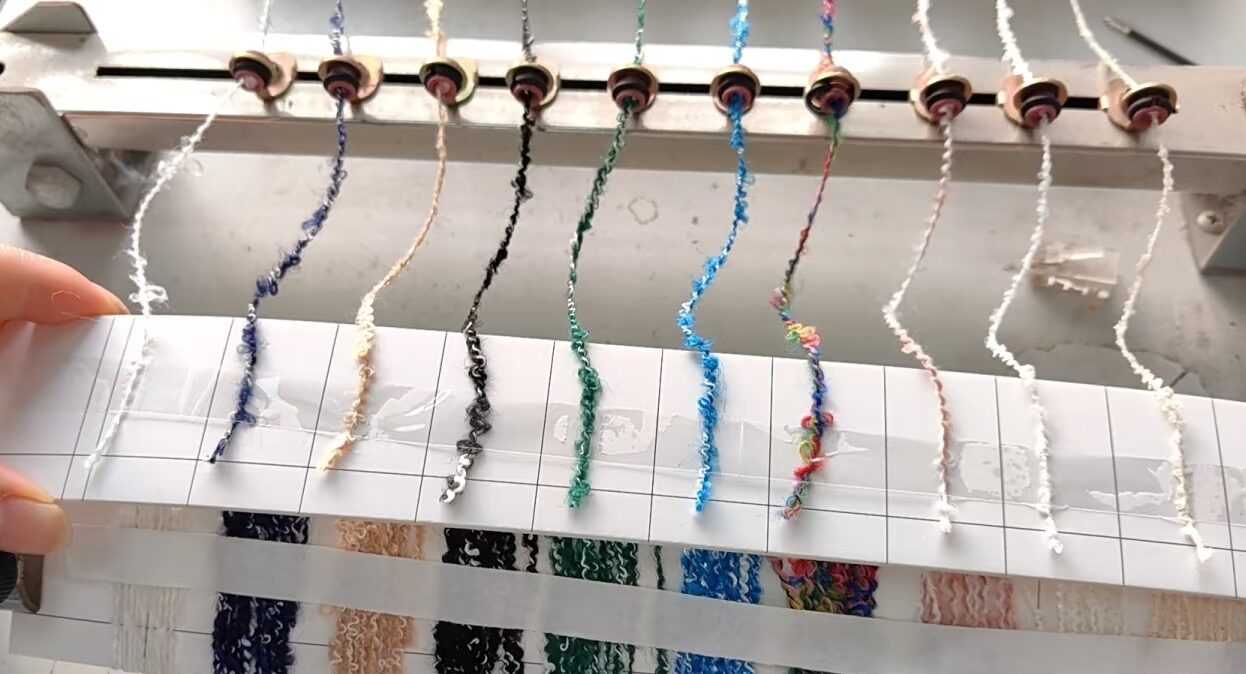
Material costs often dictate a product’s profitability, making precise price analysis crucial for B2B buyers.
This article explores how different material compositions shape your overall product cost, moving beyond surface-level figures. We’ll break down the financial impact of choices, like how materials account for the largest share of your cost of goods sold, and why wool production can be several times more expensive than other fibers. We will cover key cost drivers and provide insights for optimizing expenses.
Deconstructing the Cost Sheet
Deconstructing a cost sheet involves systematically breaking down total costs into measurable elements using hierarchical structures like WBS and CBS. This process differentiates between direct and indirect costs, leveraging specific analytical frameworks and robust data validation to identify cost drivers, optimize expenses, and ensure transparency in textile manufacturing.
Principles of Cost Sheet Decomposition
Utilizing hierarchical structures like `Work Breakdown Structure (WBS)` and `Cost Breakdown Structure (CBS)` for breaking down total project scope and costs in fabric production.
The role of `Product Breakdown Structure (PBS)` in assigning costs to components such as specific fabric materials, labor, and energy consumption.
Distinguishing between `variable costs` (e.g., raw materials, direct labor, energy) and `fixed costs` (e.g., depreciation, rent, insurance) within a textile cost sheet.
Enabling identification of primary cost drivers, opportunities for optimization, and enhancing transparency for all stakeholders.
Analytical Frameworks and Validation
Calculating `Prime Cost` as the sum of direct materials, direct labor, and direct expenses for a given textile production run.
Applying `Activity-Based Costing (ABC)` to accurately allocate overheads to specific manufacturing activities, such as dyeing processes, weaving, or finishing.
Leveraging standardized cost codes, similar to `CSI` and `NAHB` in construction, for consistent categorization of textile manufacturing costs.
Ensuring data reliability through `Bill of Materials (BOM)`, labor standards, and historical performance data for accurate cost validation.
Using `Standard Cost Sheets` to set predetermined benchmarks for production elements, facilitating the identification and analysis of cost variances.
Top 3 Cost Drivers
Manufacturing costs are primarily driven by labor inefficiencies, often linked to a lack of employee know-how, and issues with equipment reliability, including outdated technology and frequent machine breakdowns. Additionally, complex product designs, characterized by tight tolerances or intricate features, significantly escalate expenses by necessitating specialized processes and tooling.
| Cost Driver | Description | Impact & Data |
|---|---|---|
| Labor Inefficiencies & Lack of Employee Know-how | Production errors, lower productivity, and increased rework stemming from inadequate training. | Labor is a significant expense; inadequate training causes errors and rework. |
| Outdated Technology & Machine Breakdowns | High operating costs, frequent maintenance, and interruptions in production. | Businesses lose significant sums annually from obsolete technology; it increases downtime and maintenance. |
| Complex Design Features & Tight Tolerances | Designs incorporating varying radii, very tight tolerances, or features requiring five-axis machining. | Varying radii increase cycle times dramatically; very tight tolerances multiply part costs several-fold. Design influences the majority of total product cost. |
In manufacturing, the main cost drivers relate to human factors, equipment reliability, and design complexity. When employees lack knowledge or processes are inefficient, it causes errors, rework, and even safety concerns. Machine breakdowns from older technology further amplify downtime and maintenance expenses. These operational problems worsen if processes are manual or inconsistent, leading to inefficient workflows and higher reject rates.
Hidden costs are significantly shaped by product design. Design choices impact the majority of total expenses, particularly through features like non-orthogonal geometries or tight tolerances that require advanced machining or specialized tools. Material choice and the number of parts also increase expenses, as using premium or non-standard components prevents economies of scale. For example, a part might drop to a fraction of its small-batch unit cost at higher volumes through standardization. Quality control that is separate from the production process often increases rework, while integrating measurement with CAD data reduces costs.
Benchmarks show consistent patterns: materials typically account for the largest share of the cost of goods sold. Total manufacturing costs should stay within a healthy share of total revenue. High production yields, above 95%, minimize waste. Supply chain risks, such as fluctuating raw material availability, affect many companies. This highlights the importance of Design for Manufacturability (DFM) early in the process to achieve a meaningful savings without sacrificing functionality.
Cost Impact of Wool Percentage
Increased wool content in blends directly correlates with higher fabric costs. Wool is significantly more expensive to produce and process than other fibers. Key factors like fiber diameter, clean yield, and staple length profoundly influence raw wool prices, with premium blends reflecting these quality-driven costs.
| Trait | Influence on Price | Quantified Impact |
|---|---|---|
| Fiber Diameter | Primary cost driver; accounts for the majority of clean price variation. | a 1-micron increase reduces price measurably. |
| Clean Yield | Directly impacts raw material value. | a 1% increase adds measurably to raw material cost. |
| Staple Length | Minor influence on raw material price. | a unit increase adds marginally. |
| Vegetable Matter (VM) | Leads to price discounts, especially for finer wool. | Accounts for a small share of price variation. |
Wool Percentage: The Core Cost Driver
Higher wool content in blends (e.g., 70/30 or 60/40) directly increases fabric cost.
Wool production and processing costs are several times higher than manmade or other natural fibers.
This cost difference significantly amplifies the per-percentage impact of wool in fabric blends.
Key Fiber Traits and Market Price Dynamics
Fiber diameter is the primary cost driver, explaining the majority of clean wool price variation; a 1-micron increase reduces price measurably.
Clean yield influences price, with a 1% increase adding 0.115 R/kg to the raw material cost.
Premium wool-polyester blends command a higher per-yard price in high-quality markets (e.g., U.S.), contrasting with standard blends at a lower per-yard price.
Global Textile Excellence: Our Operational Pillars
Fancy Yarn Economics
Fancy yarn is a specialty textile input experiencing mid-single-digit growth, driven by design innovation and complex production. Its economics are characterized by a price premium over commodity yarns, costs tied to fiber type and advanced manufacturing, and sensitivity to consumer disposable income and global economic volatility.
Global Market Dynamics and Value Drivers
The global fancy yarn market is projected to keep growing steadily over the coming decade.
Market growth is estimated in the mid-single-digit CAGR range, ahead of mature commodity yarns.
Fancy yarn commands a price premium due to its aesthetic effects, specialized design, and complex spinning operations.
Innovation, with a growing share of new developments focusing on durability, sustainability, and design flexibility, drives market value.
Cost Structure and Macroeconomic Sensitivities
Fiber class significantly influences cost, with natural fibers commanding premiums and synthetics offering affordability.
Conversion costs are elevated by advanced manufacturing processes, including air-jet/vortex spinning and automated weaving.
Demand is sensitive to discretionary consumer spending and currency volatility, given its classification as a non-essential, high-end product.
Economic fluctuations can increase raw material prices, particularly for imported inputs, leading to higher unit costs and more frequent contract price revisions.
Dyeing Economics
Dyeing economics are primarily driven by achieving right-first-time quality, as rework dramatically increases costs. Compliance with environmental regulations and standards like OEKO-TEX adds overhead but reduces risk. Advanced technologies such as waterless CO₂ dyeing offer significant operational savings by 2026.
Quality Control and Regulatory Cost Drivers
Each color correction or production add can noticeably increase dyeing costs over the original cost.
Stripping and re-dyeing a lot can more than double the normal dyeing cost.
Eco-regulations in 2026 limit wastewater parameters (e.g., COD, pH, temperature) and heavy-metal impurities in dyes (e.g., Ba 100 ppm, Cd 50 ppm, Cr 100 ppm, Pb 100 ppm).
Compliance with standards like ISO 105 (colorfastness) and OEKO-TEX STANDARD 100 dictates required testing and chemical portfolios by 2026.
Process Innovation and Efficiency Gains
Functional cost basis is normalized to 1 kg of textile product under ISO 139 standard conditions (20 °C ± 2 °C and 65 % RH ± 2 %) for technical calculations by 2026.
High-pressure disperse dyeing for polyester at 130–135 °C improves dye uptake and colorfastness, reducing rework in 2026.
Advanced technologies like digital textile dyeing or supercritical CO₂ dyeing can cut operating costs substantially.
Supercritical CO₂ dyeing for polyester eliminates water, enabling solvent recovery and shifting cost structures from water/effluent to capital expenditure and CO₂ compression/recirculation by 2026.
Cost-Benefit: Wool vs. Blends
Choosing between pure wool and blends involves balancing raw material cost, performance attributes, and market positioning. While 100% wool offers luxury and superior drape at a higher price, blends provide enhanced durability, easier care, and better cost efficiency, making them suitable for diverse market segments in 2026.
| Feature | 100% Wool | Wool Blends |
|---|---|---|
| Raw Material Cost | Significantly higher; cost drivers include micron, length, strength. | Lower due to synthetic/other fiber inclusion; cost rises with wool percentage. |
| Luxury/Perceived Value | High, superior drape, premium positioning. | Maintains wool perception while balancing cost. |
| Durability/Abrasion | More durable, retains appearance longer. | Enhanced abrasion resistance due to blend components. |
| Wrinkle Resistance | Good, but blends can offer further enhancement. | Improved wrinkle resistance. |
| Care Instructions | Often requires specialized cleaning. | Easier care, often machine washable. |
| Thermal/Moisture | Excellent insulation and moisture-wicking. | Retains core wool thermal/moisture properties. |
| Market Positioning | Luxury, high-end garments, bespoke tailoring. | Mass to mid-premium markets, volume production. |
| U.S. Price (per yard) | Higher (not specified but above blends). | High-wool: higher; 50/50: moderate. |
| China Price (per yard) | Higher (not specified but above blends). | High-wool: moderate; 50/50: lower. |
| Typical GSM Range | Wide range, often 200-400+ gsm. | Light: 200–260; Mid: 260–320; Heavy: 320–400+. |
| Wool Content | 100% | Typically 20–80% (common 30–70%). |
| Lifecycle Value | Longer wear, better appearance retention, higher resale value. | Lower upfront cost, easier care, optimized cost per wear. |
The Value Equation: Pure Wool vs. Blended Fabrics
Raw wool’s significantly higher cost compared to synthetics directly impacts fabric unit cost, rising with increased wool percentage. Factors like fineness (micron), staple length, strength, and color are central to raw wool pricing.
Pure wool provides a luxury market position, superior drape, longer wear life, and a higher perceived value. In contrast, wool blends maintain wool’s thermal and moisture-wicking properties while adding benefits such as increased abrasion resistance, wrinkle resistance, and easier care.
Market Pricing and Strategic Application
Current market benchmarks for wool-polyester blends in 2026 show high-wool blends (70/30, 60/40) price at a premium per yard in the U.S., while 50/50 blends sit lower. In the Chinese market, comparable high-wool blends price moderately, and 50/50 blends lower still.
Commercial wool blends usually contain 20% to 80% wool by fiber weight, with fabric weights commonly ranging from 200–400+ gsm. Pure wool is the choice for luxury or high-end garments. For volume production, 50–70% wool blends are often selected to manage cost and care requirements effectively.
Final Thoughts
Cost engineering in textiles means closely examining every production element. Material choices, like wool percentage and specialty yarns, directly impact the final price. Design complexity, along with operational issues such as labor inefficiencies and equipment reliability, also drives up manufacturing costs. Businesses need to analyze these factors to effectively manage expenses and improve transparency.
For businesses, this translates into a need for strategic material selection and process optimization. The choice between pure wool and blends must align with market positioning and product performance goals. Early integration of Design for Manufacturability (DFM) offers substantial cost reductions. Furthermore, investing in employee training, modern equipment, and advanced dyeing technologies significantly cuts waste and improves overall efficiency. Focusing on these areas helps companies make informed production decisions and maintain a competitive edge.
Frequently Asked Questions
Is 100% wool a worthwhile investment?
Yes, 100% wool is worth it for products needing verified fineness and quality. USDA-style grading defines premium grades by fine average fiber diameter (finer than 80s) with low dispersion. This allows for superior softness, durability, and fine Super-number labeling. This standard applies in 2026.
Why is piece-dyed fabric generally more affordable?
Piece-dyed fabric is typically cheaper because dyeing occurs in large, continuous lots at the fabric stage. This process minimizes handling, labor, and waste. Mills spread dyeing setup, chemical, and energy costs over hundreds of yards, driving the per-yard dye cost down sharply in industrial runs. Custom piece-dye rates for apparel fabrics carry a low per-yard charge with a yardage minimum, versus a higher per-pound charge with a smaller minimum for garment dyeing.